|
|
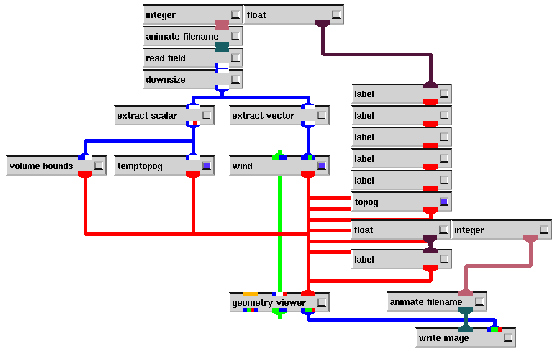
The topog macro module used in Figure 9 is identical to that used in the second visualisation, shown in Figure 8. The temptopog macro module, shown in Figure 10, simply encapsulates the task of generating the terrain of Australia coloured according to surface temperature which was performed in the second visualisation, shown in its main network in Figure 7.
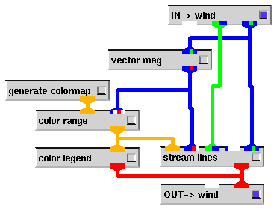
The wind macro module, as shown in Figure 11, visualises the wind velocity10 as a set of streamlines coloured according to the magnitude of the wind velocity (ie. the wind speed) at each point.
The volume bounds module provides context for where the current horizontal slice plane ``fits'' within the whole dataset. Notice in Figure 3 that the volume bounds are not a rectangular prism, due to the irregularity of the underlying dataset, as discussed in Section 1.2.
There are no animated integers or animated floats in the main network11. This is because there is no easy way to select the plane used by the streamlines module. Thus the animation for this network was performed by hand, using the Geometry Viewer's Transform Object control to move the streamlines plane up by 0.5 units each frame. The integer controlling the output filename and the float controlling the frame number display label module were then updated and the process repeated for each frame.